
A couple of days ago there was an article on HN that gained a lot of traction. Naturally it got the kiss of death and the site went down.
Since I was load-testing some calls on Supplybunny, I figured I might as well see how much traffic could this site take.
This site is hosted on a $10 DigitalOcean droplet, the main purpose of which is a WordPress installation that uses most of the resources. It is built with Jekyll, so it’s actually all static files. It has very few other assets such as images.
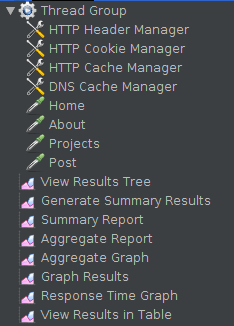
I set up a JMeter script that visits the home, about and post pages:
Simple enough.
I ran it at three different loads.
| Ramp-up | Iterations | Threads | Throughput (r/s) | Median response (ms) | 99% response (ms) | Error rate |
| 0s | 100 | 100 | 945.6 | 114 | 291 | 0.00% |
| 0s | 200 | 1000 | 685.3 | 581 | 3993 | 0.01% |
| 200s | 400 | 2000 | 555.9 | 2535 | 4818 | 0.2% |
2000 threads is the maximum that I could get with 16GB of ram and 12GB heapsize so I did it with double the iterations.
Overall that’s pretty good and shows just how good nginx is at serving static files.
At least for this site I don’t have to worry about bot traffic spikes.
As a side thought, I compared a load test with and without the cache controller:
| Throughput | Median response | 99% response | |
| Cached | 945.6 | 100ms | 291ms |
| Not cached | 162.3 | 616ms | 2301ms |
This definitely makes me appreciate more just how big of a difference cache makes.